Introduction
Chillisauce is the largest group activity based travel company in the UK, sending over 150,000 people a year on stag weekends, hen parties, and corporate events and other group based activity weekends.
As the leader in the field we need to constantly keep ahead of market trends, and keep our eye out for the next 'hot location' or activity. As you may expect we are as fond of our seaside resorts as our clients, and we therefore need to keep our fingers on the pulse of what is going on in the great British seaside towns, and how things may change in the future. Which towns are treading down the path of culture lead regeneration and foodie hubs, which could make ideal locations for a corporate event, and which others are moving along 'vibrant nightlife' path which could become the next stag and hen hotspot.
As a company we also have a duty of care for our customers, and as well as making sure they have amazing weekends, we want to make sure they can enjoy their time in as safe environment as possible. Therefore, on the same premise that we always ensure the venues we use are fully compliant with health and safety regulation, or not places renowned for particular problem. We find it useful that we have some understand of the towns and cities vices, so we may advise client from an informed position, on how best to look after themselves on a weekend. In Europe this comes in the form of local guides, who will give all our customer advice on how to have a great safe weekend, but in the UK, it's a little more hands off, so we need to put more of an emphasis on our own research.
As part of our research, one thing we have looked at is the national crime data, as it can give us some insight into where the town is heading, along with the seaside resorts in general. While this research has been for our own internal use, we thought that it would be helpful to publish it, as it highlights quite a number of stark facts, that we haven't seen before, and could be helpful to those in charge are seaside town development strategies.


The Data
All our source data is publicly available from the national police website, and we have been crunching this data, to get it into a useful and format to look at key factors relating to seaside towns.
As a cut-off point for the towns we looked at, we took the figure of a residential population 10,000 people, as when you get smaller than this the crime figures start to get to small to make meaningful assumptions, and from our business perspective we are mostly interesting in these size of town.
If you look at previous studies on seaside towns, one of the things that you see is that a lot of towns get grouped together as a larger conurbation EG Margate, Broadstairs and Ramsgate, would be come under a single category of 'Thanet'. We didn't like this approach, as although they may come under a single umbrella local authority or such other entity, we know that they have very distinct characteristics, and should be treated as such. People living in seaside towns tend to be very patriotic about their own area, and if your from Brixham, your likely to identify as such - as opposed to saying you live in 'Torbay' (the encompassing Unitary Authority which also includes Torquay and Paignton). We therefore, where possible have tried our best to segment the data into relevant distinct towns which readers will more identify with.
3 Key Metrics for 70 Seaside Towns
There an almost endless amount of information that can be crunched from the source data, but we have focussed our research on 3 core metrics:
Average Crime
We wanted to see the levels of crime in across all the different categories defined by the police. To make things comparable between locations, we have adjusted the figures to reflect the population of the area and translated them into 'number of crimes registered per 1,000 people' over one year.
Change in Crime
We thought it was important to see the direction in which crime was changing. To do this we took the latest data of the last 2 years and compared it to the preceding 2 years. We decided do this as opposed to looking at change over one year to even out any anomalies caused by low data sets, to provide a much truer picture as to what was really happening.
Tourist Crime
One thing we thought would be interesting to discover was how much of the crime reported in a town was tourist related. Obviously for many of these towns 'tourism' is their lifeblood, but that is not without cost, and we wished to see how the tourism may negatively affect the location population by an increase in crime. To do this we looked at the average crime figures across all metrics over the time period and compared how crime reported changed from the least touristy months (Dec, Jan & Feb), to the most touristy months (Jun, Jul & Aug)
The Time Range
We took a time range of May 2013 (when the crime categories were last changed) to October 2018 (the last date where all towns have produced crime data).


Key Findings - Seaside Towns vs UK Averages
Average Crime Levels.
Anti-social behaviour (ASB) - Seaside towns have 33% higher crime than the UK average.
Violence and sexual offences - Seaside towns have 34% higher crime than the UK average.
Criminal damage and arson - Seaside towns have 29% higher crime than the UK average.
Public order - Seaside towns have 14% higher crime than the UK average.
Drugs - Seaside towns have 9% higher crime than the UK average.
Shoplifting - Seaside towns have 30% higher crime than the UK average.
All Other Crime - Seaside towns have 13% higher crime than the UK average.
Total Crime - Seaside towns have 19% higher crime than the UK average.
Seaside towns have a 19% higher level of crime than the UK average. Most of this can be accounted for by increases seen in the past 4 years where crime levels have increased 17% more than the UK average.
How crime has changed over 4 Years:
Anti-social behaviour (ASB) - Seaside towns performed 33% worse than the UK average.
Violence and sexual offences - Seaside towns performed 16% worse than the UK average.
Criminal damage and arson - Seaside towns performed 3% worse than the UK average.
Public order - Seaside towns performed 55% worse than the UK average.
Drugs - Seaside towns were 47% higher than the UK average.
Shoplifting - Seaside towns performed 14% worse than the UK average.
All Other Crime - Seaside towns performed 14% better than the UK average.
Total Crime - Seaside towns performed 17% worse than the UK average.
Violent Crime and Sexual Offences - Have seen a massive increase over the 4 years of 54%, with some places recording increase well over 100%.
How crime changes in seaside towns during the tourist season:
Anti-social behaviour (ASB) - increases 59% during the summer months.
Violence and sexual offences - increases 24% during the summer months.
Criminal damage and arson - increases 14% during the summer months.
Public order - increases 62% during the summer months.
Drugs - increases 17% during the summer months.
Shoplifting - increases 12% during the summer months.
All Other Crime - increases 28% during the summer months.
Total Crime - increases 34% during the summer months.
Seaside towns see large increases in anti-social behaviour (average 59% increase) and public order offences (average increase 62%) during the tourist season.
Some perspective
Although the figures don't look good for seaside towns, more than anything I think it highlights that coastal towns have a unique set of problems and challenges that need to be addressed. While these figures don't make much attractive reading it is important to remember that these are general safe places, and if you compared Soho in London, you will find that almost all towns have less crime than this small area - and we worked in the middle of Soho for years, and couldn't recommend it highly enough.


Crime Figures by Region
East Of England
Highlights
It's maybe quite surprising that Southend-on-Sea, has the highest overall levels of crime not only in the east of England but the whole of the UK - especially when it is located right next to Leigh-on-Sea a town recently voted best place to live in the UK. Clacton-on-Sea and Great Yarmouth both score poorly for levels of crime overall, but Frinton and Walton has seen the largest increase in % of crime over the past 4 years (although it still has the lowest overall level of crime). Violent Crime and Public order offences have increased massively over the past 4 years, with Lowestoft seeing a 65% in violent crime over the past 4 years and Frinton and Walton a 86% increase in public order offences. To be fair to Finton and Walton though, they do come bottom for most crime categories overall (along with Leigh-on-Sea).

North East Of England
Highlights
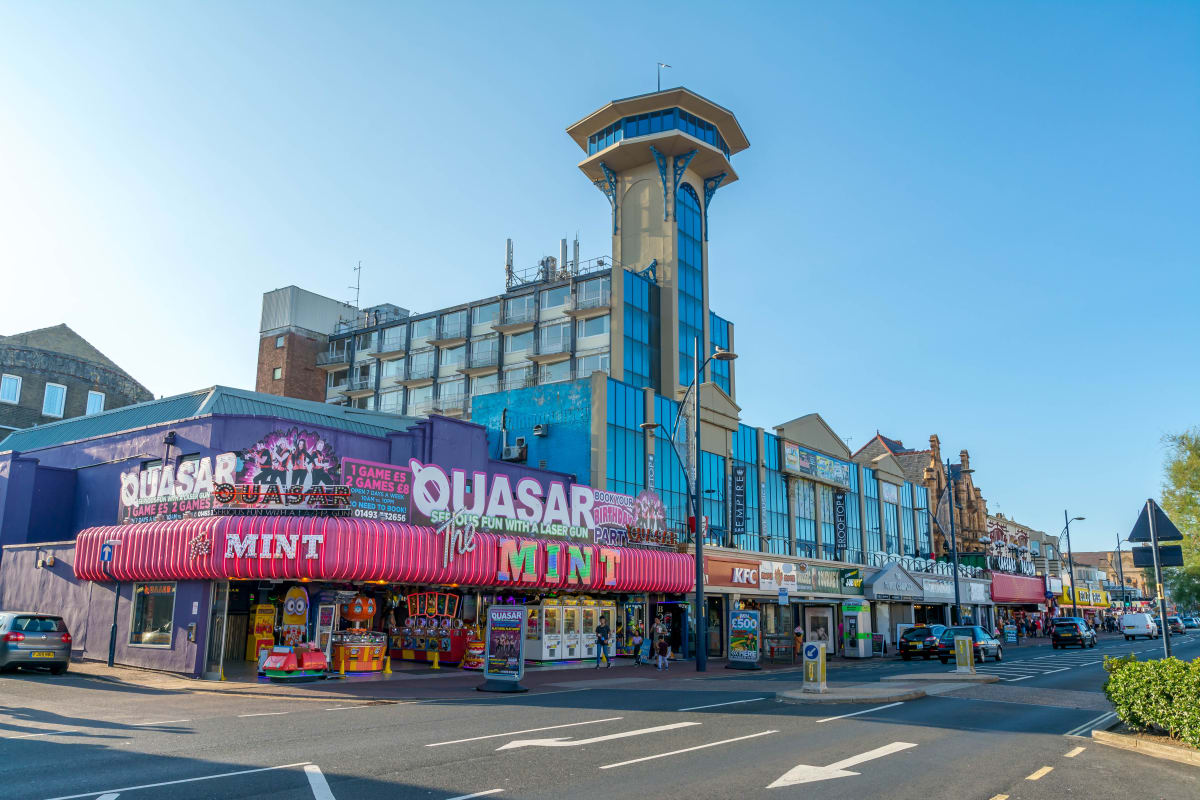
Scarborough tops the list of overall crime, with Skegness a close second, followed by Whitby and Cleethorpes. When looking at where crime has increased most as a percentage over the past 4 years though, the order is largely reversed and Seaham tops the list followed by Bridlington, Whitley Bay and Mablethorpe. During the tourist season both Skegness and Mablethorpe see a staggering 50% and 49% increase in overall crime levels. Skegness also looks to have a big drugs problem during the summer months with a 65% increase in drug related crime. Cleethorpes also sees a huge 77% increase in public order offences in the tourist season, and Mablethorpes suffering residents see an 80% rise in anti-social behaviour.

North West Of England
Highlights
As maybe expected, Blackpool gets a clean sweep of all the average crime figures for the area, and it also tops the list for the area with the biggest % increase in total crime and the largest increase during the tourist season. The most shocking figure however goes to Lytham St. Annes which has seem an astonishing 456% increase in public order offences over the past 4 years (It also sees huge rises during the tourist season). Formby has seen a 128% rise in drugs crime over the last 4 years, and Fleetwood an 80% rise in violent crime. New Brighton (61%), Southport (56%) and Fleetwood (48%) all see very large increases in anti-social behaviour during the tourist season.
South East Of England
Highlights
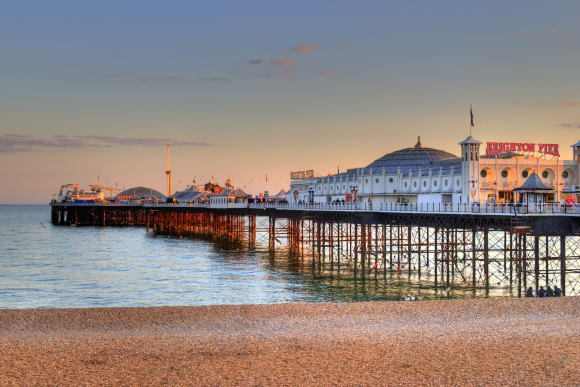
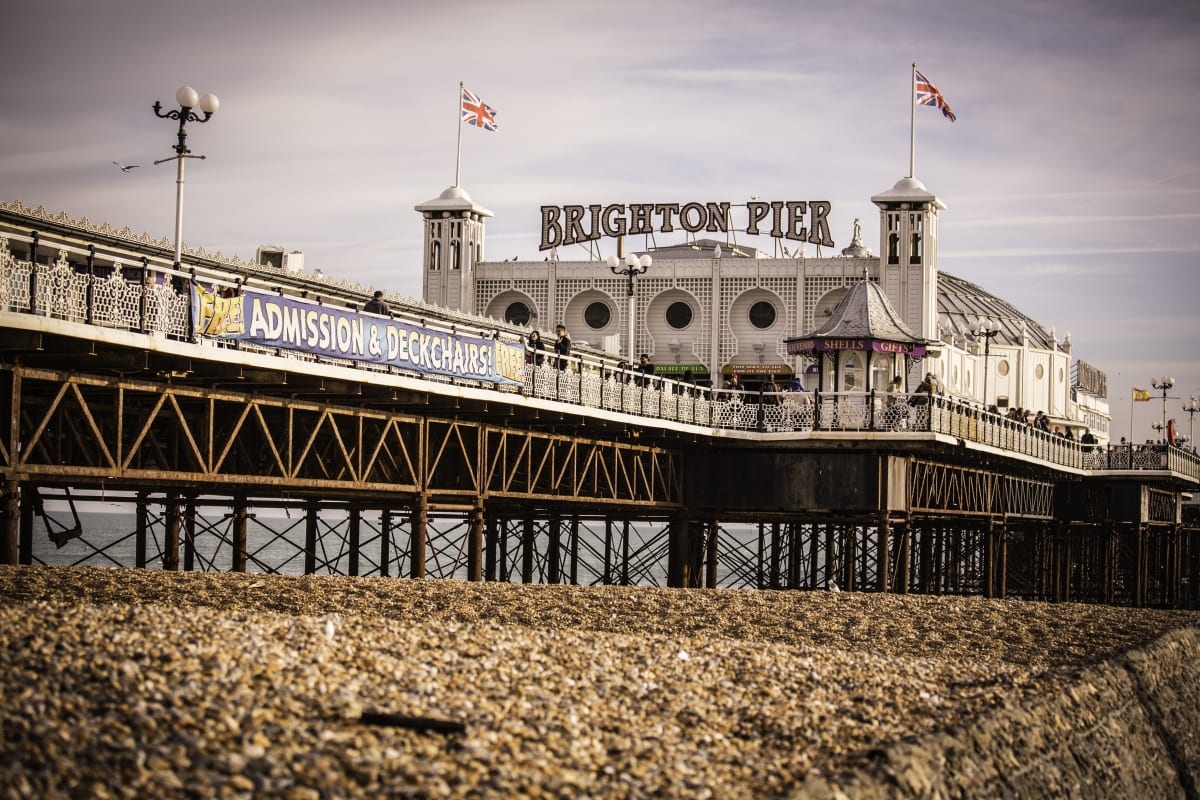
Margate takes the crown as the crime capital, followed closely by Dover, then Ramsgate. What may be surprising however is how Bognor Regis is the 4th worst for total crime in the area, and comes above Hastings, Brighton and Folkestone - even topping the list for shoplifting and coming 3rd for anti-social behaviour and public order offences.
Looking at places that have seen big % increases in crime over the past 4 years a range of places may surprise; Deal has seen a 110% increase in violent crime, and Lymington only just behind on 106% - even genteel Broadstairs has seen an 80% increase. Whitstable and Herne Bay have seen truly staggering increases in public order offences of 484% and 443% respectively. Deal has also seen a 41% increase in drugs crime over the past 4 years. Brighton and Hove, gets a note that it is the only place in the South East that saw 'no increase' in total crime over the past 4 years (Hastings also fared well with just a 1% increase).
South West Of England
Highlights
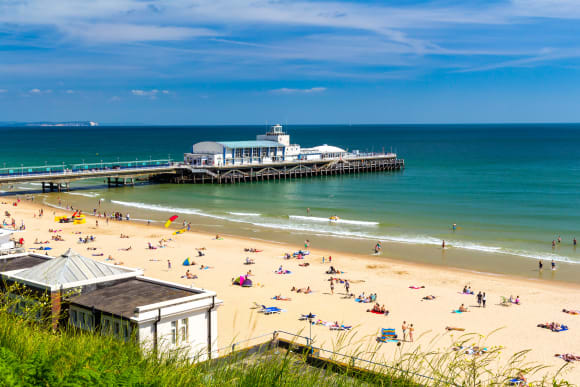
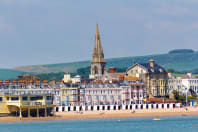
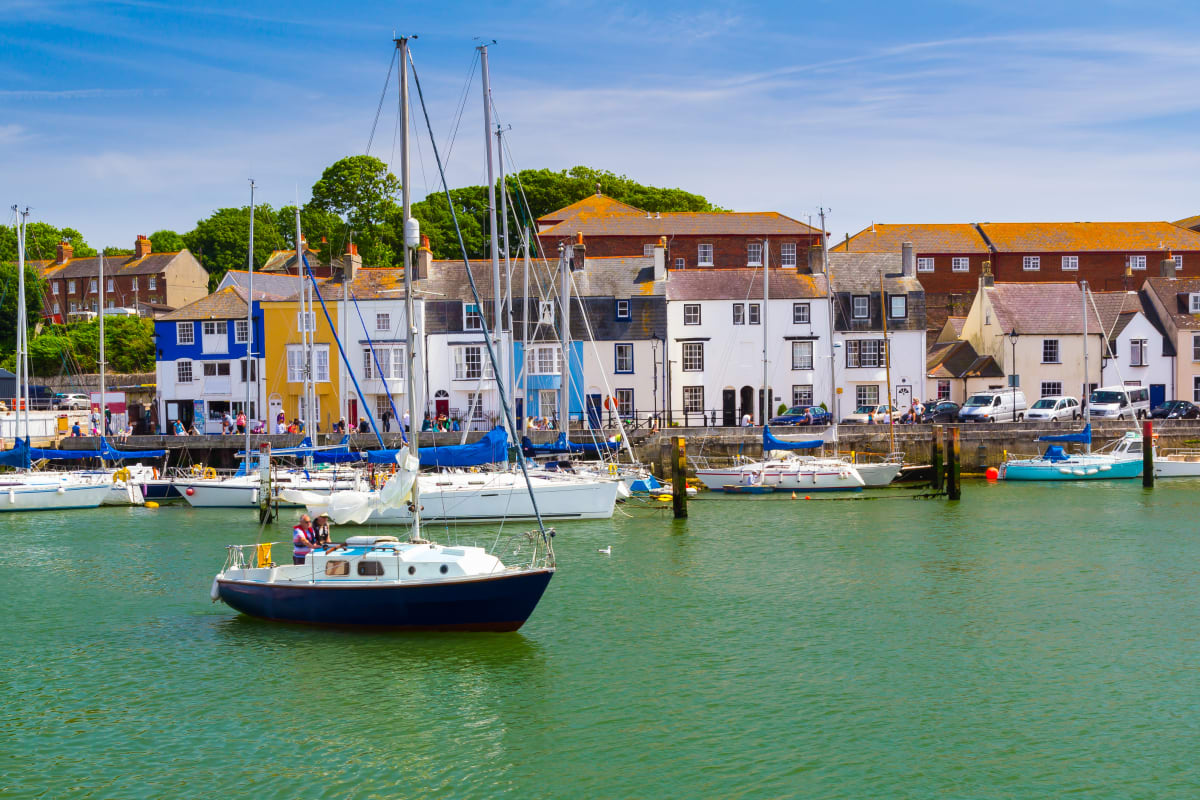
Weymouth tops the list for total crime, anti-social behaviour and criminal damage out of the 22 resorts we looked at in the South West, while its neighbours Bridport and Swanage came 2nd and 3rd from bottom for total crime. Toquay and Newquay have the largest amount of drugs related crime and weston-super-mare comes top for public order offences. Bournemouth came second in the area for anti-social behaviour and total crime and has seen a 15% rise in total crime over the past 4 years.
When looking at towns who have seen the largest percentage changes in the levels of crime over the past 4 years, it is dominated by a lot of towns you would not generally associate with crime; Teignmouth has seen an 83% increase in violent crime, Dawlish a 60% increase in criminal damage, Minehead (144%) and Christchurch (113%) both huge increases in public order offences, Exmouth has seen the largest increase in drugs crime with 53%, followed by Weymouth on 50%. Burnham-On-Sea has seen the biggest % increase in total crime on 39%, followed by Teignmouth on 33% and Ilfracombe and Poole on 24%.
During the tourist season Newquay sees a huge 85% increase in all crime and a 105% increase in drug related crimes. However, Newquay is an exception to almost all other locations in that it has become a bucket list destination for well healed teenagers to head to in the summer school holidays. Many of the more genteel resorts also see very high increases in crime during their tourist season with Swanage on 75%, Sidmouth 69%, Dawlish 56% and Minehead on 53%.

Wales
Highlights
The seaside crime capital of Wales is Rhyl, coming top in all but 1 of the total crime categories - a place taken by Aberystwyth which has the highest drugs crime not just in Wales but the whole of the UK. Most of the towns in Wales have high crime levels with only 2 towns having less than 100 reported crimes per 1000 people This compares poorly with the South West where more than half of all towns came under this mark.
Penarth has the lowest level of total crime, but has also seen the largest % increase in crime levels of the past 4 years with 22%. All the seaside towns in Wales have seen an increase in total crime over the past 4 years, with Bangor performing the best with just a 1% increase in all crime, followed by Barry on 4%.
When looking at where crime increases most heavily during the tourist season we see large increases in anti-social behaviour in all towns - particularly Penarth 110%, Porthcawl 96%, Prestatyn 69% and Barry 65%, Llandudno 51% and Colwyn Bay 50%.


All UK Resorts - Complete Data Tables


Purple Flag - In recognition of safety or crime????
As part of investigation we became aware of the Purple Flag 'awards', run by the Association of Town and City Management. Their aim is to promote a 'safe and vibrant nightlife', through an assessment and award scheme.
While the ideas behind the scheme seem perfectly honorable, after looking at our data, we think they may want to have a look at their assessment methods.
Of the 70 seaside towns we analysed, six had obtained the purple flag status, yet they all don't come out smelling of roses when you look at crime:
The Purple Flag Seaside Towns:
- Southend-on-Sea - Worst for overall crime and violent crime in the UK
- Aberystwyth - Worst for drugs crime in the UK
- Weymouth - Worst for overall crime, and 2nd worst for violent crime in the south west .
- Bournemouth - 2nd Worst for overall crime and 6th worst for violent crime in the south west
- Torquay - 3rd Worst for overall crime and worst for violent crime in the south west
- Weston-Super-Mare - 4th Worst for overall crime and 3rd worst for violent crime in the south west
We noted that in an article about Southend retaining its purple flag status, that "their inspection which took place between 6pm on Friday 7 December and 2am on Saturday 8. As a company that specialising in selling nightlife to thousands of customers a year, we'd recommend that doing an inspection until 2am in the morning, when the clubs are open till 4, 5, or 6, is not going to give a true reflection of what goes on.


Leigh-on-Sea vs Southend-on-Sea
One thing that came to our attention recently was that Leigh-on-Sea, had been named as the best place to live in the UK, in a recent report by rightmove.
When we were looking into the data for Southend-on-Sea we recognised that the 'Southend conurbation' encompasses 'Leigh-on-Sea', but as the have stated before, we wanted to make sure the analysis we were doing represented the distinct towns as much as possible, and it was quite certain from the articles and interviews that residents and the articles, considered Leigh-on-Sea and Southend-on-Sea as distinctly different places. Therefore unlike other previous studies which grouped them together, we decided to separate their data out.
The best place to live shoulder to shoulder with the coastal crime capital!
After crunching the number the data was pretty stark. While Leigh-on-Sea maybe a very nice place to live, its next door neighbour, Southend has an enormous crime problem! Southend easily topped our charts on almost every crime crime category - with 292 total recorded crimes a year for each 1000 people it is around 4 times higher than Leigh, and leaving Blackpool in second place with 217 crimes per 1000, behind in the dust!


Do Stag and Hen Weekends Impact Anti-Social Behaviour?
Stag and hen weekends get a bad press with regarding anti-social behaviour connected to drinking. To get some understanding if hen and stag parties are one of the key drivers of anti-social behaviour in seaside towns, we took an a look at the main locations that all the stag and hen agencies actively promote to groups, and are most popular amongst those traveling to destinations outside their home town. Currently these key locations are Bournemouth, Brighton, Newquay and Blackpool.
Then we need to normalise the data to take account of underlying crime that has nothing to do with tourism or stag/hens. To do this we therefore need to look at the 'change' in anti-social crime rates during summer (when the stag and hen parties will arrive - along with other tourists), and see if there is any significant pattern between the stag and hen towns and all other seaside towns.
When looking at how anti-social behaviour rates in these locations increase in the tourist season we see they rank 64th, 45th, 5th and 61st respectively. Then getting an average of those values we get a rank of 44th - so in-fact significantly below the average which would be 35th.
While we are not going to claim that stag and hen weekends improve anti-social behaviour, these stats don't indicate that they significantly increase it either. The outlier in those stats above is Newquay where they get a big increase in anti-social behaviour -, much of their problems have been associated with the school age youths that descend in groups on the town in summer, as opposed to stag and hen weekends, which are on average a bit more mature and on average in their 30's. Unfortunately in can be one of those things were everyone gets tarred with the same brush, and maybe the fancy dress doesn't help when it comes to drawing attention!
Newquay's population of 20,000 swells to 120,000 during the height of the season, but it is the resort's growing appeal to underage drinkers celebrating the end of their GCSEs and A-levels that is blamed for most problems.
While we obviously have a vested interest, and would obviously not ask anyone to take our opinions as verbatim, we have provided the data to allow you to make your own opinions.
One caveat that should be noted is that when we talk about 'popular stag and hen destinations' we are here referring to those destinations which are marketed and sold by stag and hen agencies. Such agencies generally market to a more 'mature and affluent' customer than the stag and hen market as a whole. Therefore there are locations which are known as stag and hen weekend destinations (such as Skegness), but are only used in the main by stag and hen groups who organiser everything themselves - or go to all inclusive camps such as Butlins..
So it is therefore likely that to possible understand the situation holistically you would need to look at both 'agency organised' stag and hen weekends in isolation from DIY stag and hen weekends. Obviously it is in our interests that our groups behave as best as possible, and it is for this reason that we always arrange daytime activities as part of the package. Other than making for a much more interesting event, it keeps the groups out of the pubs during their day, which from our experience can be a precursor to problems later in the evening. As we also provide guided pub-crawls and dedicated guestlist bar/club entry we manage any potential issues as well as possible.
Appendix
Crime Categories
There are a lot of different crime categories that are provided by the police crime reports. We thought that some of these were less relevant than others and to display them all would be overkill and take away from the key findings therefore we have taken a 'chunk' of the least relevant categories and classified them under a single category 'all other crime'.
Below are the categories and definitions as defined in the UK police data reports:
Anti-social behaviour (ASB) - Includes personal, environmental and nuisance anti-social behaviour. N.B. ASB is not a crime but a civil offence.
Criminal damage and arson - Includes damage to buildings and vehicles and deliberate damage by fire.
Drugs - Includes offences related to possession, supply and production.
Public order - Includes offences which cause fear, alarm or distress.
Shoplifting - Includes theft from shops or stalls.
Violence and sexual offences - Includes offences against the person such as common assaults, Grievous Bodily Harm and sexual offences.
All Other Crime - This is the total of all below crime categories: -
Bicycle theft - Includes the taking without consent or theft of a pedal cycle.
Burglary - Includes offences where a person enters a house or other building with the intention of stealing.
Other crime - Includes forgery, perjury and other miscellaneous crime.
Other theft - Includes theft by an employee, blackmail and making off without payment.
Possession of weapons - Includes possession of a weapon, such as a firearm or knife.
Robbery - Includes offences where a person uses force or threat of force to steal.
Theft from the person - Includes crimes that involve theft directly from the victim (including handbag, wallet, cash, mobile phones) but without the use or threat of physical force.
Vehicle crime - Includes theft from or of a vehicle or interference with a vehicle.
Total Crime - Total for all categories including crime and ASB.
Notes: - Police reports were currently only available for England and Wales, and all seaside resorts examined were also only in England and Wales. When we refer to 'UK' crime figures we are actually specifically only referring to those of England and Wales.